NumPy와 Matplotlib#
아나콘다는 파이썬 기본 패키지에 각종 수학/과학 라이브러리들을 같이 패키징해서 배포하는 버전이다. 넘파이는 행렬이나 일반적으로 대규모 다차원 배열을 쉽게 처리 할 수 있도록 지원하는 파이썬의 라이브러리이다. 사이파이는 넘파이를 기반으로 고급 수학 함수, 수치적 미적분, 미분 방정식 계산, 최적화, 신호 처리 등에 사용하는 다양한 과학 기술 계산 기능을 제공한다.

넘파이#
ndim: 차원(축)의 수
shape: 각 차원의 크기(튜플)
size: 전체 요소의 개수, shape의 각 항목의 곱
dtype: 요소의 데이터 타입
itemsize: 각 요소의 바이트 크기
import cv2

image = cv2.imread('./img/cat-01.jpg')
print(type(image))
print(image.ndim)
print(image.shape)
print(image.size)
print(image.dtype)
print(image.itemsize)
---------------------------------------------------------------------------
ModuleNotFoundError                       Traceback (most recent call last)
Cell In[1], line 1
----> 1 import cv2
      3 image = cv2.imread('./img/cat-01.jpg')
      4 print(type(image))

ModuleNotFoundError: No module named 'cv2'
import numpy as np

np.array([[1, 2, 3], [4, 5, 6], [7, 8, 9]])
array([[1, 2, 3],
       [4, 5, 6],
       [7, 8, 9]])
a = np.empty((3, 3))
a
array([[ 1.14285714, -2.28571429,  0.57142857],
       [-2.28571429,  4.97142857, -1.54285714],
       [ 0.57142857, -1.54285714,  0.88571429]])
a.fill(255)
a
array([[255., 255., 255.],
       [255., 255., 255.],
       [255., 255., 255.]])
np.zeros((3, 3))
array([[0., 0., 0.],
       [0., 0., 0.],
       [0., 0., 0.]])
np.ones((3, 3))
array([[1., 1., 1.],
       [1., 1., 1.],
       [1., 1., 1.]])
np.full((3, 3), 255)
array([[255, 255, 255],
       [255, 255, 255],
       [255, 255, 255]])
np.arange(1, 10)
array([1, 2, 3, 4, 5, 6, 7, 8, 9])
np.arange(1, 10).reshape((3, 3))
array([[1, 2, 3],
       [4, 5, 6],
       [7, 8, 9]])
dtype
int8, int16, int32, int64
uint8, uint16, uint32, uint64
float16, float32, float64, float128
complex64, complex128, complex256
bool
image = cv2.imread('./img/cat-01.jpg')
image
array([[[ 31,  43,  31],
        [ 30,  42,  30],
        [ 27,  41,  29],
        ...,
        [  9,  42,  28],
        [  7,  43,  27],
        [  6,  42,  26]],

       [[ 32,  44,  32],
        [ 31,  43,  31],
        [ 28,  42,  30],
        ...,
        [  8,  41,  27],
        [  7,  40,  25],
        [  5,  41,  25]],

       [[ 29,  43,  31],
        [ 28,  42,  30],
        [ 27,  41,  29],
        ...,
        [  6,  39,  25],
        [  6,  39,  24],
        [  5,  38,  23]],

       ...,

       [[192, 183, 173],
        [191, 182, 172],
        [190, 180, 173],
        ...,
        [236, 231, 230],
        [230, 225, 224],
        [226, 221, 220]],

       [[193, 184, 174],
        [192, 183, 173],
        [191, 181, 174],
        ...,
        [238, 233, 232],
        [233, 228, 227],
        [229, 224, 223]],

       [[194, 185, 175],
        [193, 184, 174],
        [192, 182, 175],
        ...,
        [240, 235, 234],
        [235, 230, 229],
        [231, 226, 225]]], dtype=uint8)
image.shape
(443, 444, 3)
a = np.empty_like(image)
b = np.zeros_like(image)
c = np.ones_like(image)
d = np.full_like(image, 255)
print(a.shape)
print(b.shape)
print(c.shape)
print(d.shape)
(443, 444, 3)
(443, 444, 3)
(443, 444, 3)
(443, 444, 3)
image.astype(np.float32).dtype
dtype('float32')
# 차원 변경
a = np.arange(6)
a
array([0, 1, 2, 3, 4, 5])
b = a.reshape(2, 3)
b
array([[0, 1, 2],
       [3, 4, 5]])
c = np.reshape(a, (2, 3))
c
array([[0, 1, 2],
       [3, 4, 5]])
d = np.arange(100).reshape(2, -1)
d
array([[ 0,  1,  2,  3,  4,  5,  6,  7,  8,  9, 10, 11, 12, 13, 14, 15,
        16, 17, 18, 19, 20, 21, 22, 23, 24, 25, 26, 27, 28, 29, 30, 31,
        32, 33, 34, 35, 36, 37, 38, 39, 40, 41, 42, 43, 44, 45, 46, 47,
        48, 49],
       [50, 51, 52, 53, 54, 55, 56, 57, 58, 59, 60, 61, 62, 63, 64, 65,
        66, 67, 68, 69, 70, 71, 72, 73, 74, 75, 76, 77, 78, 79, 80, 81,
        82, 83, 84, 85, 86, 87, 88, 89, 90, 91, 92, 93, 94, 95, 96, 97,
        98, 99]])
e = np.arange(100).reshape(-1, 5)
e
array([[ 0,  1,  2,  3,  4],
       [ 5,  6,  7,  8,  9],
       [10, 11, 12, 13, 14],
       [15, 16, 17, 18, 19],
       [20, 21, 22, 23, 24],
       [25, 26, 27, 28, 29],
       [30, 31, 32, 33, 34],
       [35, 36, 37, 38, 39],
       [40, 41, 42, 43, 44],
       [45, 46, 47, 48, 49],
       [50, 51, 52, 53, 54],
       [55, 56, 57, 58, 59],
       [60, 61, 62, 63, 64],
       [65, 66, 67, 68, 69],
       [70, 71, 72, 73, 74],
       [75, 76, 77, 78, 79],
       [80, 81, 82, 83, 84],
       [85, 86, 87, 88, 89],
       [90, 91, 92, 93, 94],
       [95, 96, 97, 98, 99]])
e.T
array([[ 0,  5, 10, 15, 20, 25, 30, 35, 40, 45, 50, 55, 60, 65, 70, 75,
        80, 85, 90, 95],
       [ 1,  6, 11, 16, 21, 26, 31, 36, 41, 46, 51, 56, 61, 66, 71, 76,
        81, 86, 91, 96],
       [ 2,  7, 12, 17, 22, 27, 32, 37, 42, 47, 52, 57, 62, 67, 72, 77,
        82, 87, 92, 97],
       [ 3,  8, 13, 18, 23, 28, 33, 38, 43, 48, 53, 58, 63, 68, 73, 78,
        83, 88, 93, 98],
       [ 4,  9, 14, 19, 24, 29, 34, 39, 44, 49, 54, 59, 64, 69, 74, 79,
        84, 89, 94, 99]])
Matplotlib#
Matplotlib은 데이터 시각화 라이브러리입니다. 파이썬은 해당 라이브러리를 이용하여 도표나 차트 등을 그릴 수 있습니다. 이미지 프로세싱이나 컴퓨터 비전 분야에서 여러 이미지를 화면에 띄우고 싶을 때 opencv와 함께 사용합니다.
import numpy as np
import matplotlib.pyplot as plt
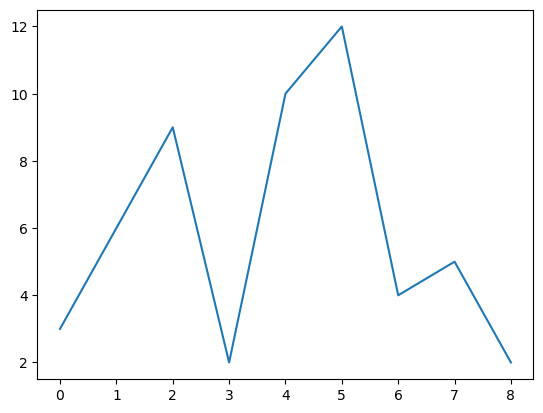
a = np.array([3, 6, 9, 2, 10, 12, 4, 5, 2])
plt.plot(a)
plt.show()
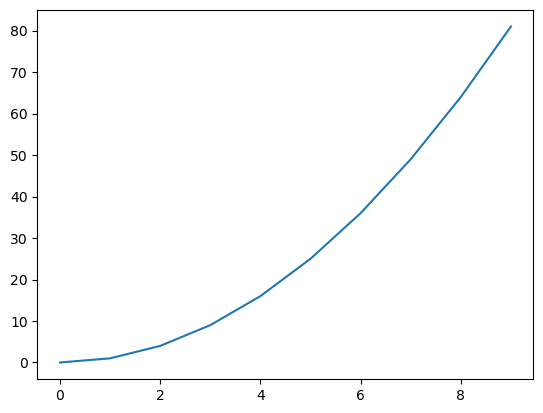
x = np.arange(10)
y = x**2
plt.plot(x, y)
plt.show()
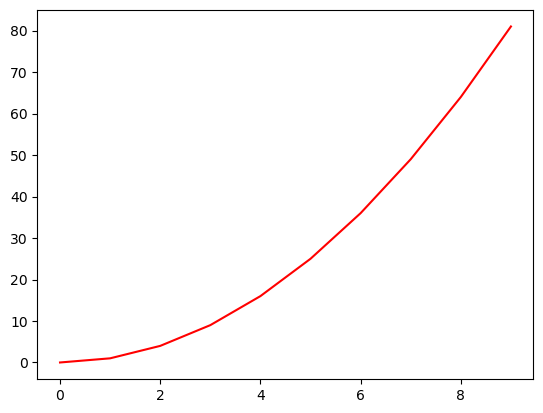
x = np.arange(10)
y = x**2
plt.plot(x, y, 'r')
plt.show()
기호 |
스타일 |
|---|---|
- |
실선(default) |
– |
이름선 |
-. |
점 이음선 |
. |
점 |
: |
점선 |
o |
원 |
> |
우삼각형 |
https://matplotlib.org/stable/api/_as_gen/matplotlib.pyplot.plot.html https://matplotlib.org/stable/api/markers_api.html https://matplotlib.org/stable/gallery/lines_bars_and_markers/linestyles.html
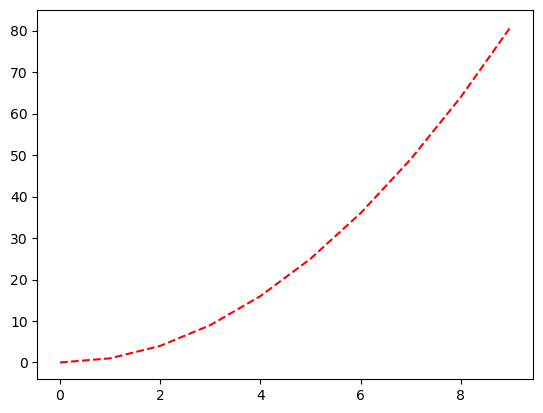
x = np.arange(10)
y = x**2
plt.plot(x, y, '--r')
plt.show()
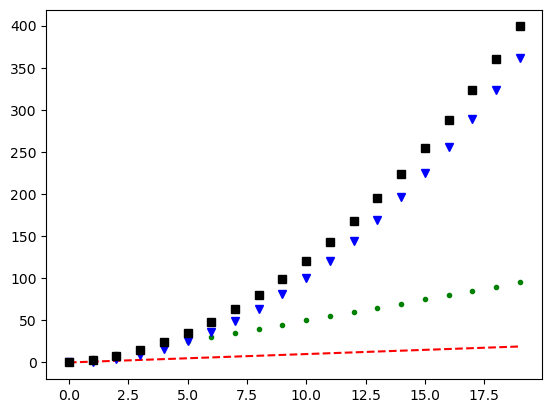
x = np.arange(20)
f1 = x * 5
f2 = x ** 2
f3 = x**2 + x*2

plt.plot(x, '--r')
plt.plot(f1, '.g')
plt.plot(f2, 'vb')
plt.plot(f3, 'sk')
plt.show()
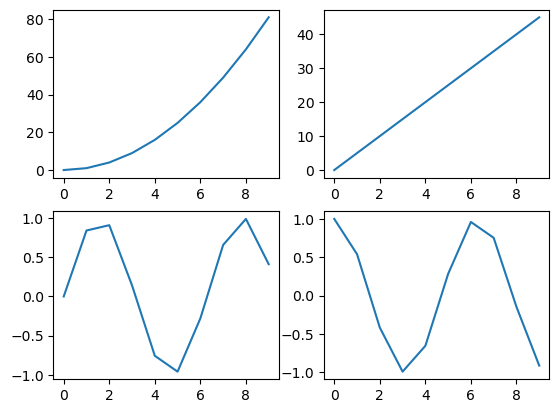
import matplotlib.pyplot as plt
import numpy as np

x = np.arange(10)

plt.subplot(2, 2, 1)
plt.plot(x, x**2)

plt.subplot(2, 2, 2)
plt.plot(x, x*5)

plt.subplot(2, 2, 3)
plt.plot(x, np.sin(x))

plt.subplot(2, 2, 4)
plt.plot(x, np.cos(x))
plt.show()